Guides & Tutorials
Using the React DevTools Profiler to Diagnose React App Performance Issues
The latest version of the React DevTools (released on Aug 23) offers a powerful new tool to detect and diagnose performance issues in your React app: the new Profiler tab! This post describes how we recently used the Profiler to quickly diagnose and fix a known and long-standing performance issue in the clientside display of our server logs on app.netlify.com.
Problem Statement
Whenever you trigger a deploy on Netlify (e.g. with a GitHub commit), a new deploy begins with an associated log. It looks like this:
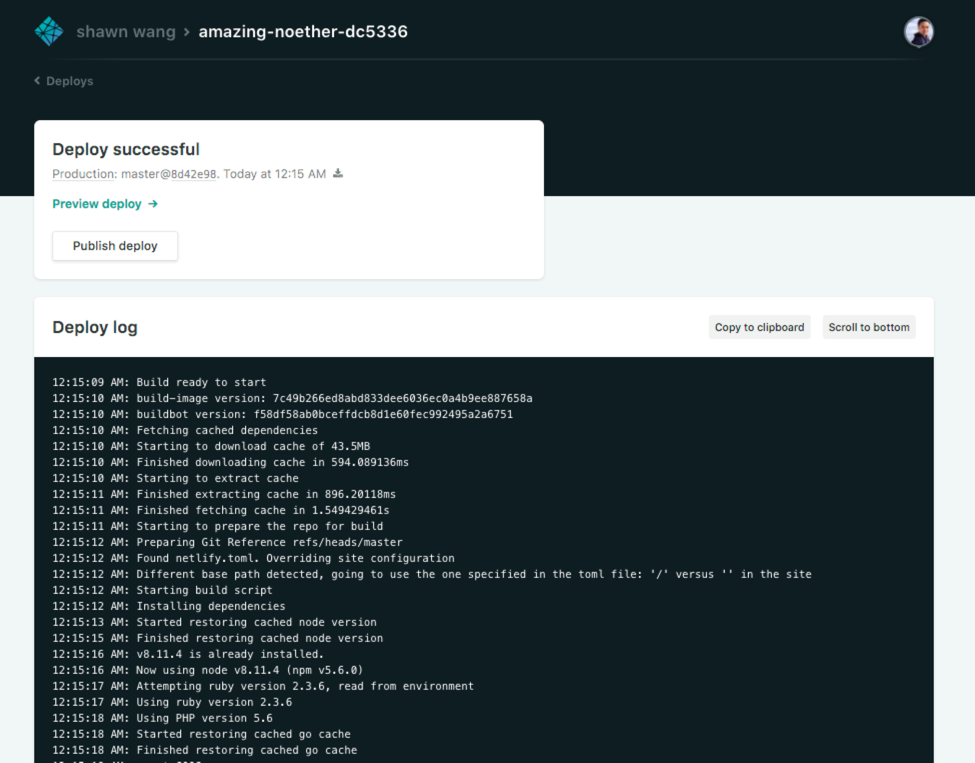
However there is a known performance problem when logs start being very, very big. You can simulate this by generating an arbitrarily large number of logs by just writing a for-loop with a bunch of console.logs (like in this repo), which looks like this:
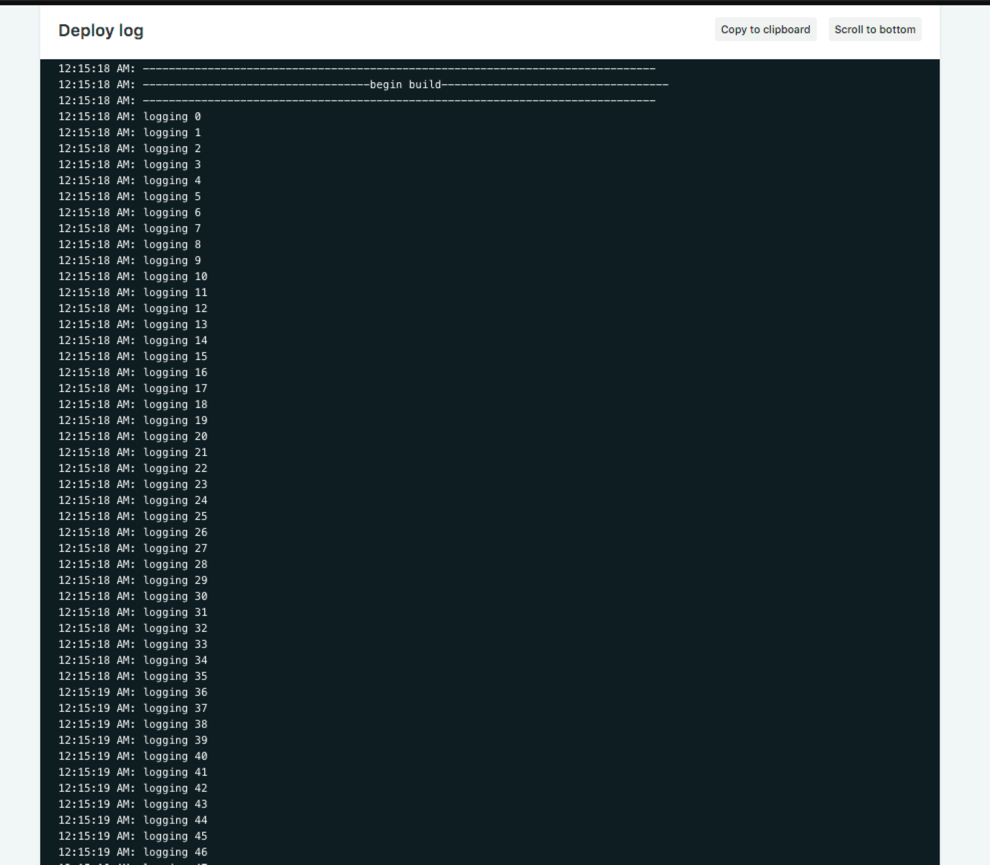
Through various customer reports with very large builds, we were getting feedback that this log screen was unresponsive for them.
Intro to React DevTools Profiler
I decided to take a look at it with the new React DevTools Profiler (note that your app must use a version of React that exposes the profiler hooks, currently only available through the prerelease link but likely to be in a future React release). Once you have it installed, switch to the Profiler tab and hit Record:
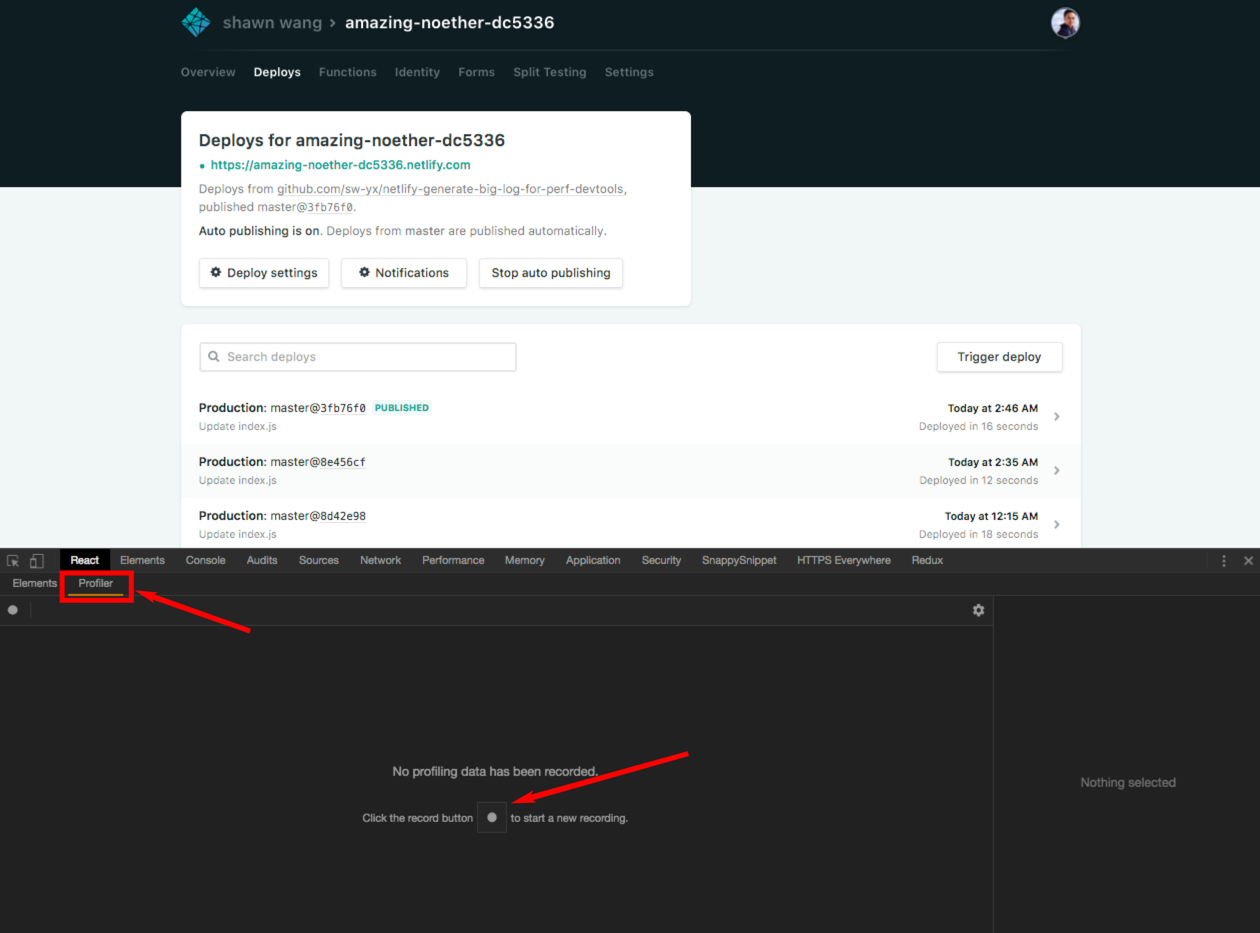
Now perform the nonperformant action. For us, it is navigating to the page that displays the large logs. Once you are done with the action, end the profiling session and you should get a flamegraph that looks like this:
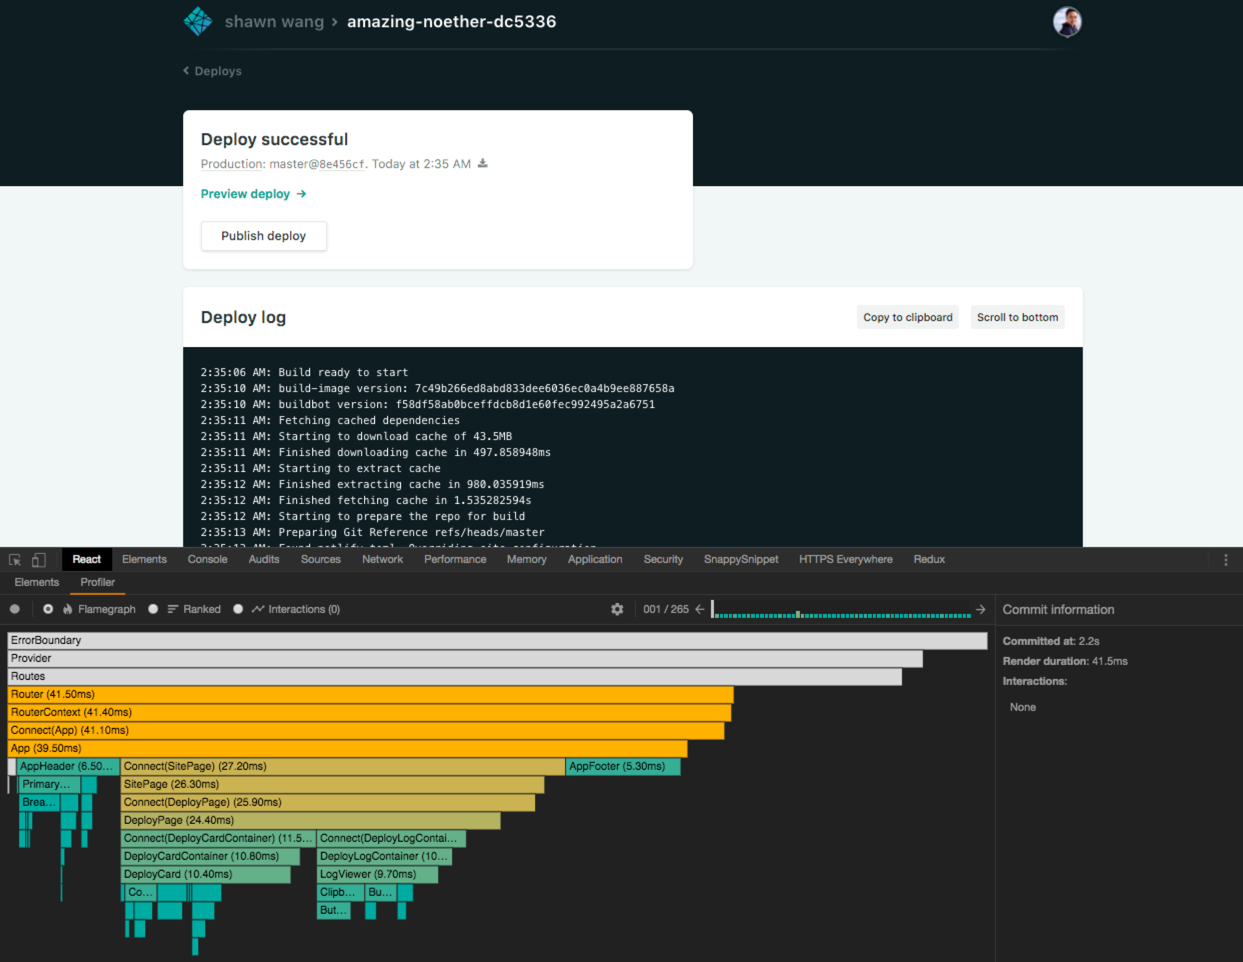
There's a lot going on there so I'll try to break it down. Let's zoom in on the right hand side of the Profiler:

What we see here is there were a total of 265 commits to the DOM during our profiling session, and the first commit occurred 2.2 seconds after I hit record, which took 41.5 milliseconds to render. Excellent!
You can also see a bar chart showing the relative render durations of all the commits — they don't all show up so you can scroll left and right on top of the bar chart to see the rest of the commits, or click into any one of them and navigate with your arrow keys. Bottom-line: if you have a particularly expensive render (say taking 900 milliseconds) it should show up easily here, and you'll be able to click into it and work out which component is causing the expensive render.
Zeroing in on the problem Component
But our app doesn't have that problem here. The problem is the other one: too many commits! Here I have 265 commits when my script runs console.log 200 times, meaning there are 65 other commits to various parts of the DOM that the console.log isn't directly responsible for.
I verify this by increasing the number of times my script prints console.log onto the server to 500, and when redoing the Profiler action I see that the commit count increases to 565 commits. So the commit count is going up linearly with the log length, and this is obviously not scalable if we have logs with tens of thousands of lines!
We're not done yet though. We can use the Profiler to zoom in on the exact component that is causing the issue. Looking around between the frames I see that there are some sections that are highlighted in colors (longer = oranger) and most of my renders are focused on rendering this DeployLogContainer component:
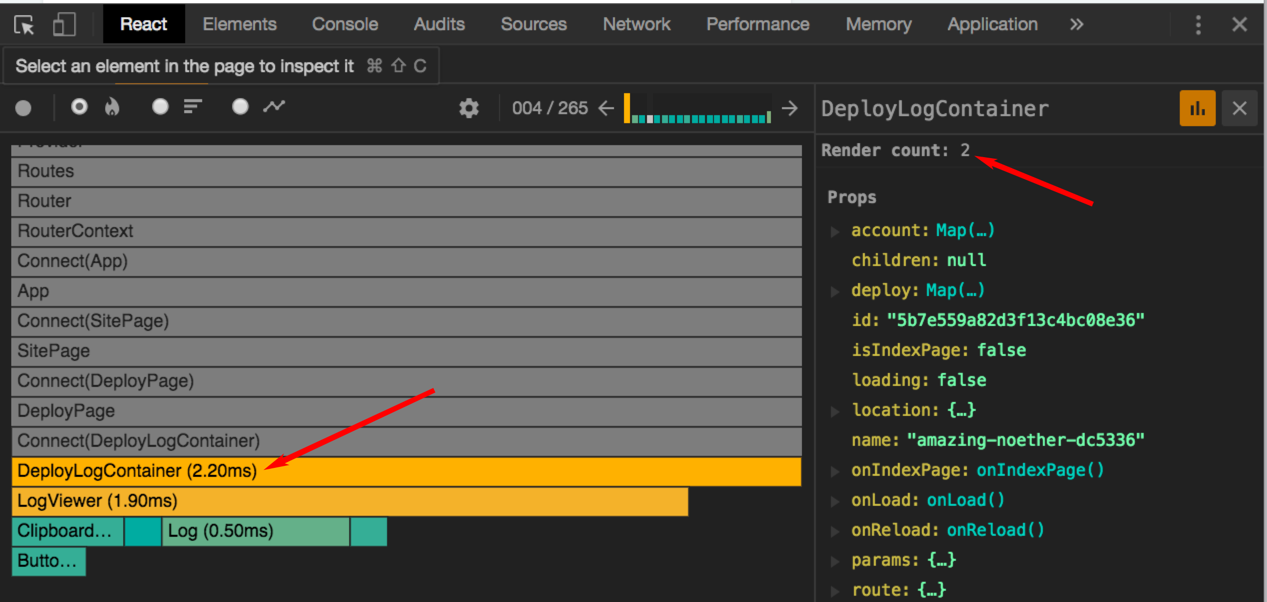
When I have DeployLogContainer selected, the right panel changes to display the props (which flash when they change as you navigate between frames!) as well as a "Render Count" field. This field is pretty useful for us — because when I navigate to the last frame of this field, guess what the Render count reads?
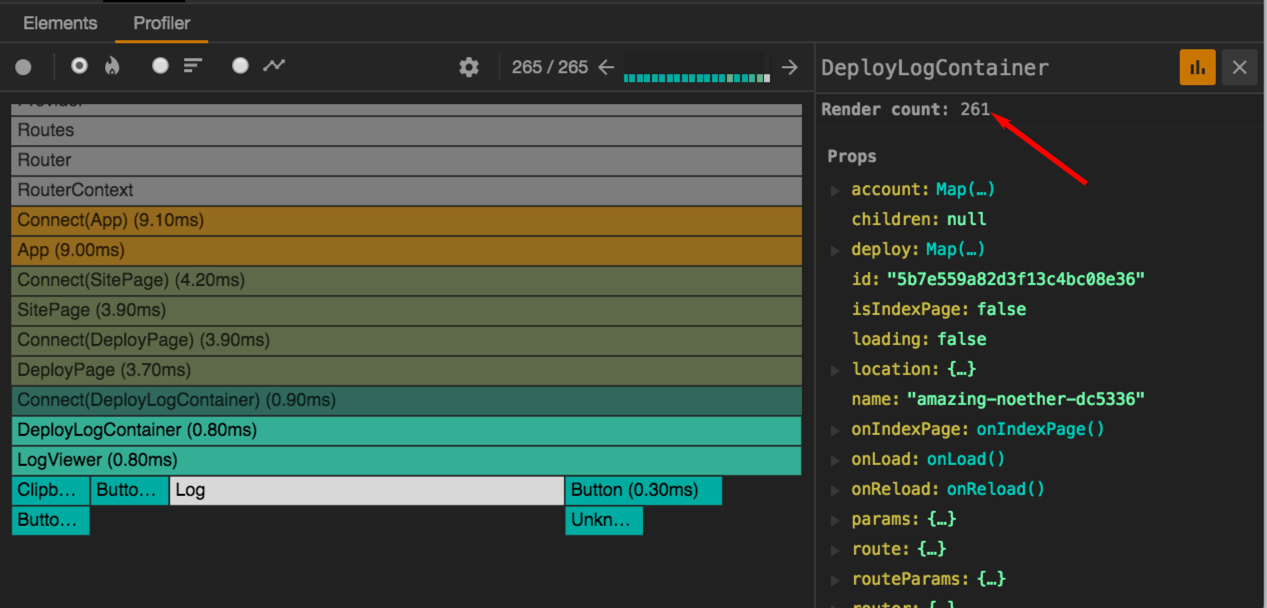
261 renders of this component! That's the cause of the performance issues.
From Profiler to Codebase
With this information, I can dive into the codebase (which I am completely new to) and be immediately effective.
Searching the files for DeployLogContainer, I find it is a component that listens for a stream of data coming in from an API with an updateLog handler, and every line that comes in is pushed onto an Immutable.js List in our state:
  updateLog(line, done, doneBefore) {
    // ...

    this.setState(state => ({
      log: state.log ? state.log.push(line) : List([line]),
      done
    }));

    // ...
  }
While this setup works for streaming logs coming in, this is going to cause a lot of commits if you load the page and there are a bunch of logs coming in on first load already. What we need is to accumulate the initial load logs and then do a single initial render.
debounceSetState
What we eventually did to fix it was write a generic way to call setState while debouncing it. First install lodash.debounce and write a debounceReduce function (so the debounce can have cumulative state):
import debounce from 'lodash.debounce'

// https://github.com/jashkenas/underscore/issues/310#issuecomment-2510502
function debounceReduce(func, wait, reducer) {
  var allargs,
      context,
      wrapper = debounce(function() {
          func(allargs);
      }, wait);
      return function() {
          context = this;
          allargs = reducer.apply(context, [allargs,  Array.prototype.slice.call(arguments,0)]);
          wrapper();
      };
}
This lets us write a custom debounceSetState function within our component:
// within DeployLogContainer

  debounceSetState = debounceReduce(
    arg => this.setState(arg),
    300,
    function(acc,args) { return acc ?
      {log: acc.log.concat(args[0].log), done: args[0].done} :
      {log: args[0].log, done: args[0].done}
    }
  )
The accumulator in the debounceReduce reducer function is basically what we will pass to the final this.setState() call after the debouncing is done, and all that logic inside the ternary helps us accumulate the state object properly within the debounce period.
Finally, we replace the setState call within our original nonperformant function with our new debounceSetState:
updateLog(line, done, doneBefore) {
    // ...
    this.debounceSetState({
      log: this.state.log ? this.state.log.push(line) : List([line]),
      done
    });
    // ...
}
And that's that!
From O(n) to O(1)
Re-running the app and Profiler, this is the new profile we get from a 500-console.log deploy log:
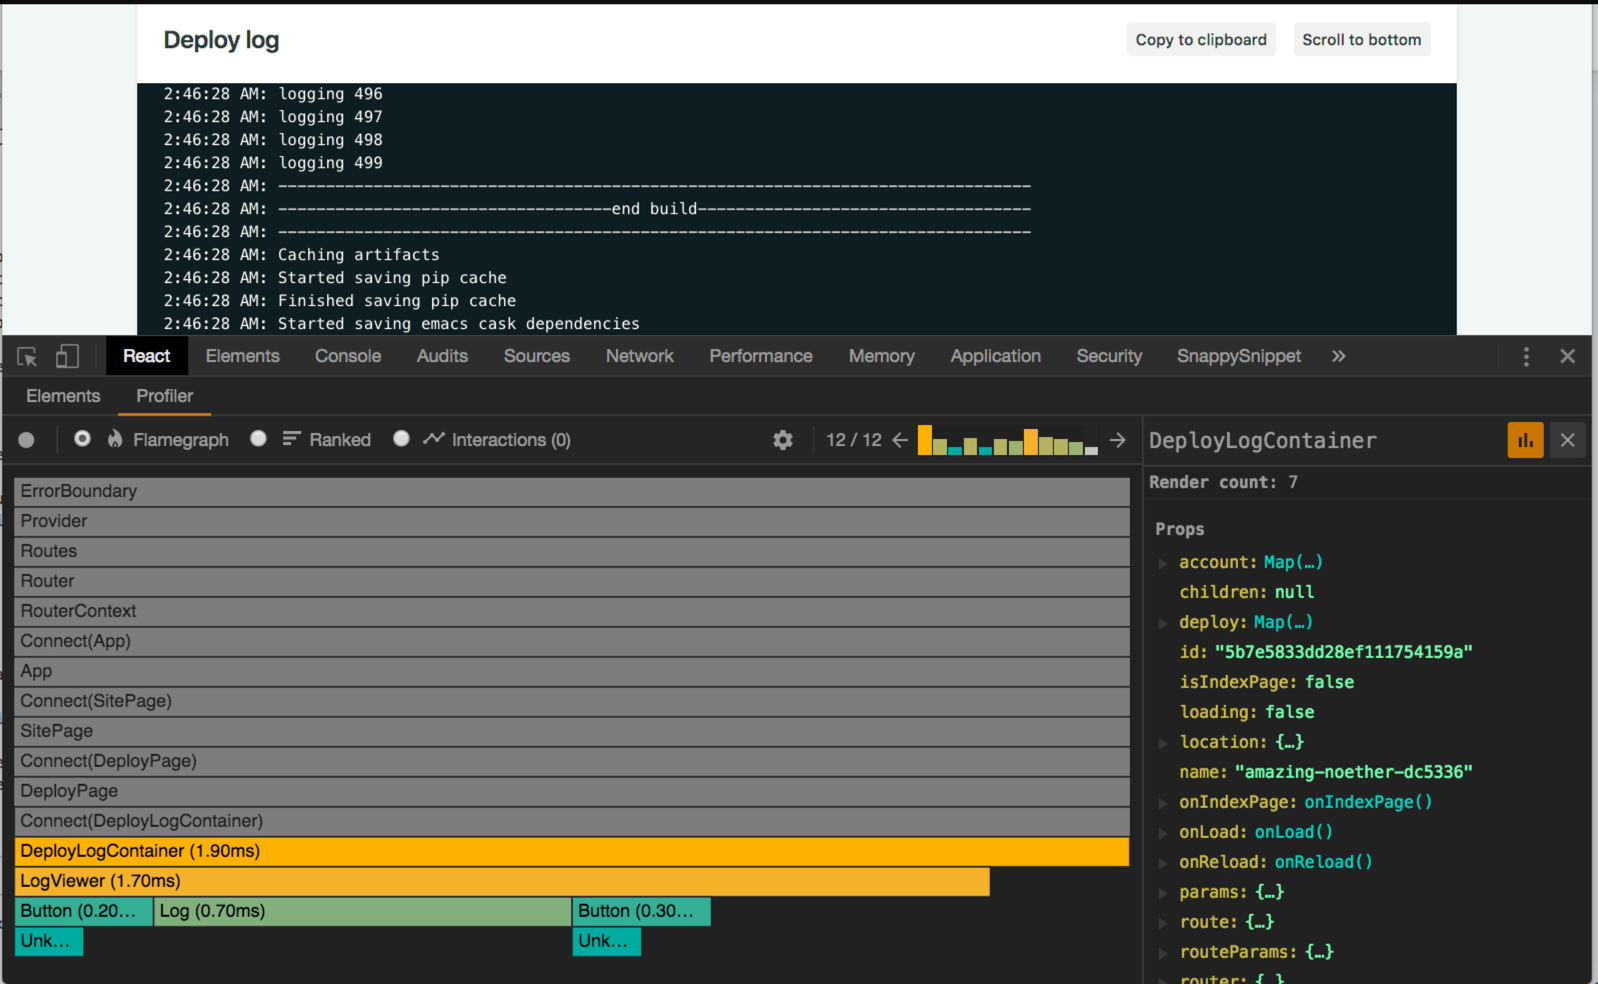
Only 12 commits! The page also loads noticeably faster. DeployLogContainer is still rendered 7 times, but presumably that is due to updates higher up in the tree, but we have fixed the big perf issue. The real test is when we go for a 10,000-line log:
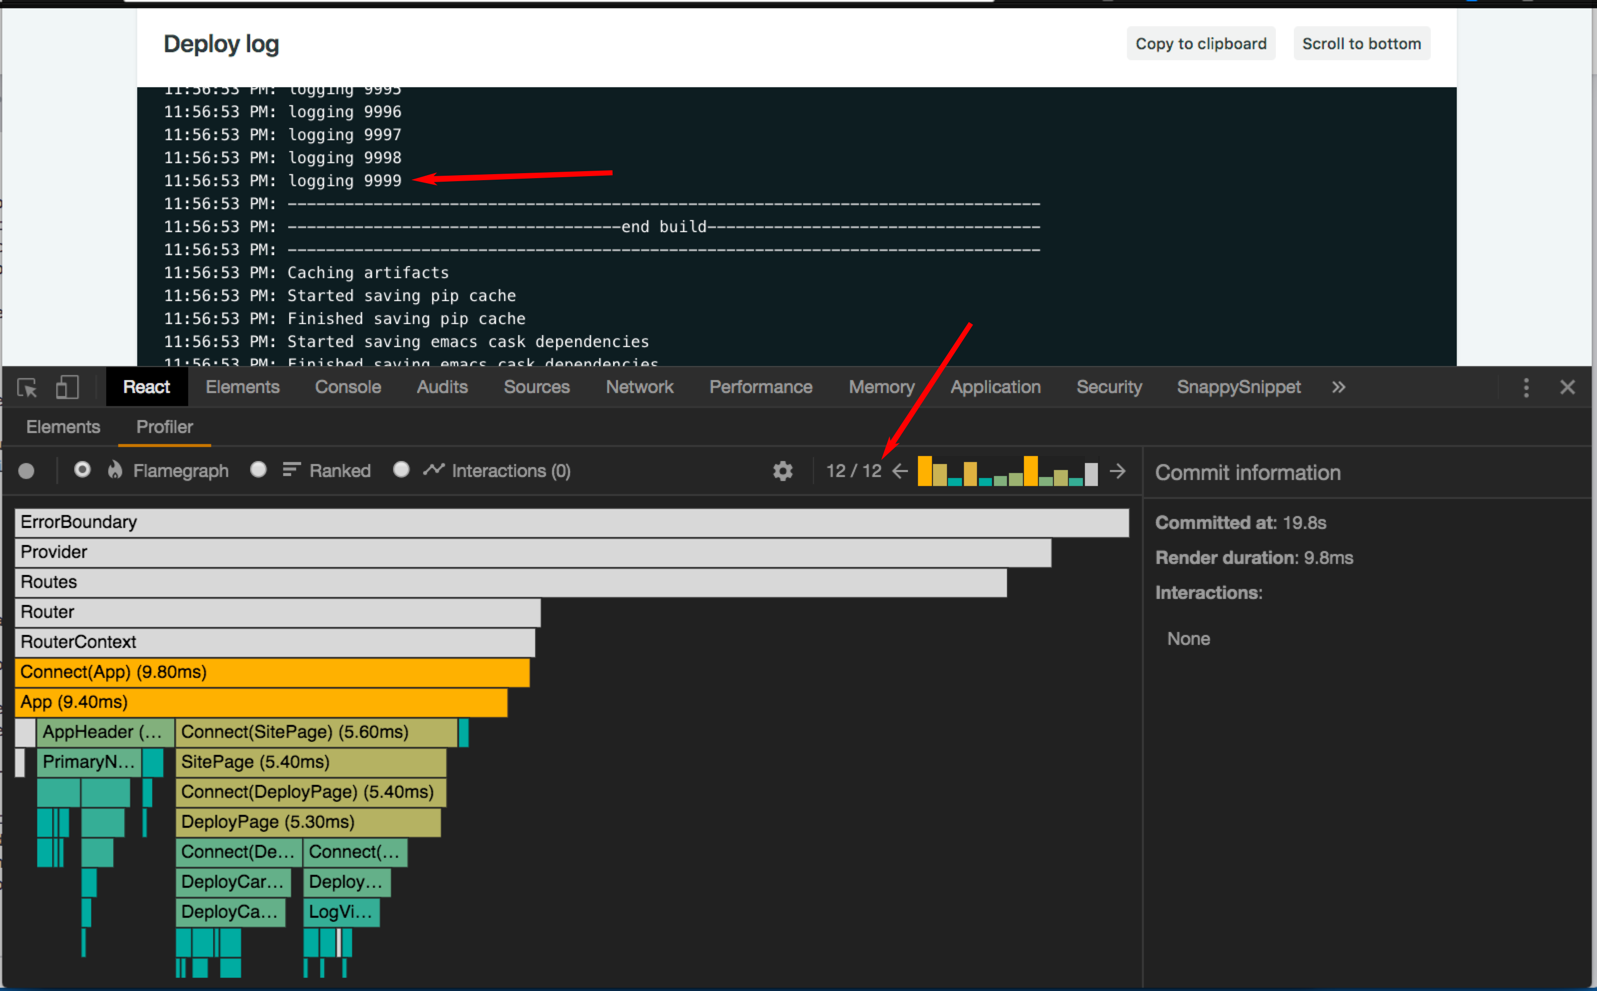
We have the same amount of commits for a 10,000 line log! Awesome! Moving our rendering from O(n) to O(1) can only be a good thing, right?
Next steps — Interaction Tracking
I hope I have given you some inspiration on how to use the new React DevTools from our case study. This can be a great time investment because the DevTools have unique knowledge of your app and can help you zoom in to the exact spot in your source code that is causing performance issues.
If you run into any problems when trying it out, be sure to report issues at the Devtools repo here.
There is another interaction-tracking module that I haven't covered here today but is also great for, well, tracking interactions in context of renders. I'd recommend playing with it yourself or keeping track of official communication from the React Team (I keep a log here which may be helpful to you). We may cover this in a future blogpost when we use it to tune our app.
