Looking to get detailed Core Web Vitals insights for your Netlify site or notifications when key metrics like First Contentful Paint deviate from a baseline? You’re in luck! In this post we’re going to look at two new tools to help you use Netlify and New Relic together for more advanced observability.
- Netlify plugin for New Relic – automatically installs the New Relic Browser agent for your Netlify projects for a seamless setup; sends helpful deploy markers back to the New Relic platform, and
- New Relic Quickstart tool for Netlify – the quickstart automatically creates a New Relic dashboard and three types of alerts for build failures, page load degradation, and JavaScript errors; this eliminates your team’s configuration time in New Relic so you can start taking advantage of monitoring and alerting right away
If your team is already using New Relic today, the integration only requires a few clicks and some copy/pasting of account details to get up-and-running.
If you don’t already have a New Relic account, you can sign up for free today!
Note: For brand new users of New Relic, you will want to skip the guided onboarding for their APM product and go straight to setting up the Browser product. After logging into New Relic for the first time, you may need to navigate away in your browser and log back into New Relic to escape the standard setup guide.
Why we love New Relic for observability
While Netlify Analytics are a powerful, privacy-forward way to observe traffic to your sites, New Relic’s platform with real-user monitoring goes further to complete the picture around performance. With custom dashboards, alerting integrations, and Core Web Vitals built-in, your team can be paged when page load speeds deviate from a baseline and get better visibility on key metrics like First Contentful Paint, First Input Delay, and Cumulative Layout Shift.
With Netlify build events synced to New Relic, you can also get a granular view of your build release cycle over time and check to see whether any errors or regressions were introduced by a recent deploy.
How to get started today
Before you enable the Netlify Build Plugin, you’ll want to create a new app in New Relic. The application object will sync to your Netlify site after you’ve completed installing the plugin and updating the environment variables.
How to create a new Browser application in New Relic
Find the “+Add more data” button in the upper-right hand corner. Under the “Browser metrics” section, choose “New Relic Browser.” When the New Relic Browser configuration screen loads, select the option to “Copy/Paste Javascript code.” Under “Name your app,” make sure that the option to “Name your standalone app” is selected, enter the name for your standalone app, and click “Enable.”
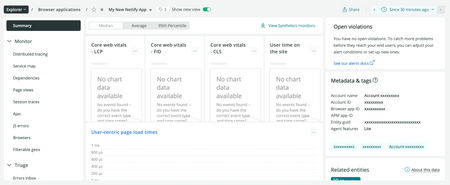
Your new application will display in the list under the Browser tab. Make note of your Account details shown in the “Metadata & tags” section for your application. You’ll want to use these details when you configure your Netlify plugin.
Installing and configuring the New Relic plugin for Netlify
Next, head over to the Netlify app and visit the New Relic plugin listing in the Build Plugins directory.
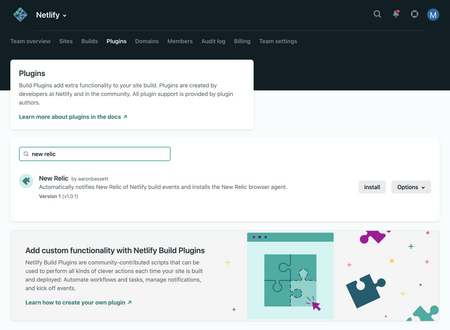
Select the site where you’d like to install the New Relic browser agent.
After you’ve installed the plugin, you’ll need to create some environment variables to sync your Netlify app to the New Relic platform.
Navigate to your Site settings > Build and deploy > Environment and create the following environment variables:
NEWRELIC_ACCOUNT_ID:Your New Relic Account ID.NEWRELIC_INGEST_LICENSE_KEY:The ingest license key you created earlier.NEWRELIC_BROWSER_LICENSE_KEY:The browser ingest license key you created earlier.NEWRELIC_APP_ID:Your New Relic Browser App ID.ENABLE_BROWSER_MONITORING:Set this to true.
Your NEWRELIC_ACCOUNT_ID and NEWRELIC_APP_ID can be found by viewing the app in New Relic and clicking on the Tag icon at the top of the dashboard. The NEWRELIC_INGEST_LICENSE_KEY and NEWRELIC_BROWSER_LICENSE_KEY can be found by navigating to the menu in the upper-right corner of the New Relic screen, selecting “Administration,” and clicking “API Keys.”
Note: It’s also possible to make these configuration changes in your netlify.toml file. Reference the plugin README to learn more.
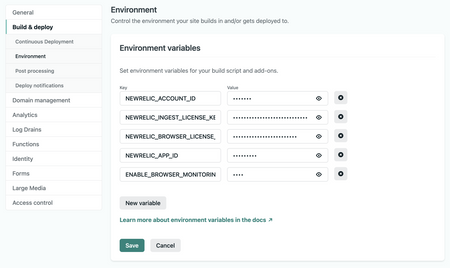
With the plugin installed and the environment variables configured, the next time you deploy your Netlify site or app and then have traffic to your site or app, you should see that traffic flowing into New Relic. Pretty cool!
Using the quickstart to create New Relic dashboards and alerts
Finally, you can use the New Relic Netlify quickstart to swiftly configure a Dashboard with some standard alerts. Click +Install quickstart and follow the prompts to build the new Dashboard in New Relic for your Netlify app.
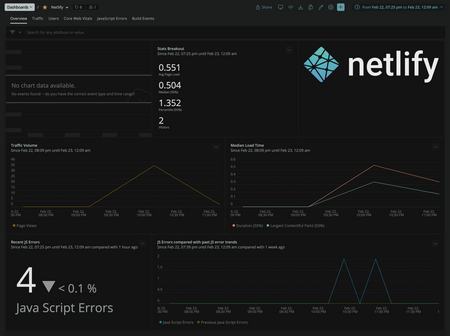
Gracefully, alerts will start in a disabled mode so you won’t get bombarded with messages before you’re ready. Visit Alerts & AI > Alert conditions (Policies) and review the settings before flipping the switch from Off to On for the alerts you want to receive.
That’s it!
With the combination of the Netlify plugin and the New Relic quickstart, you can dramatically level up your observability capabilities for your Jamstack apps—and it only takes a few minutes to get connected.
Kudos to Aaron Bassett and the entire New Relic team for putting together this integration! We’re excited to welcome this new plugin to the Netlify directory.
